

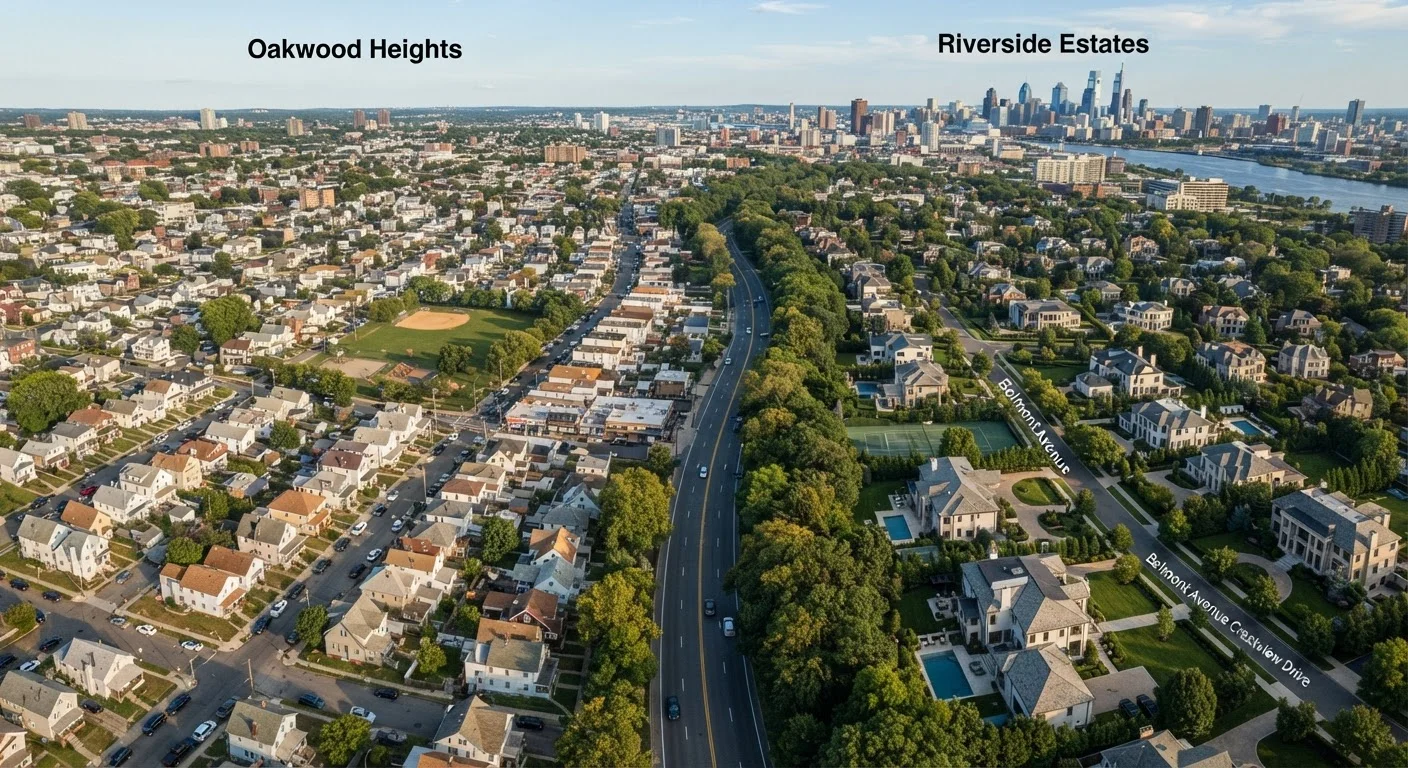
Same City, Different World
Drive thirty minutes across almost any major American city and you'll encounter a jarring reality: a three-bedroom, two-bath house might list for $250,000 in one neighborhood and $520,000 in another. Same city. Same floor plan. Radically different price tag.
This isn't a glitch in the market - it's the market working exactly as designed. Real estate pricing reflects location value far more than it reflects the physical structure on a plot of land. Understanding why requires looking at the invisible forces that make one block feel like a bargain and another feel like a premium.
If you're new to tracking the housing market, this kind of variation is one of the first things worth understanding before interpreting any price data.
10-20%
School district price premium
Urban economics research consistently finds homes in higher-rated school districts command a significant premium over comparable nearby properties.
2x+
Price gap within one metro area
In many large U.S. cities, median home prices in the most expensive neighborhoods can exceed those in the least expensive neighborhoods by more than 100%.
~25%
Walkability value premium
Studies examining walkable urban neighborhoods have found price-per-square-foot premiums over comparable car-dependent areas can reach roughly 25% in some markets.
The School District Effect
Few factors swing intra-city home prices as consistently as school district boundaries. Parents willing to pay a premium for access to higher-rated public schools create concentrated, sustained demand in specific zones - and that demand inflates prices for every home inside the boundary, regardless of whether the buyers have children.
The boundary itself is often invisible on the ground. A house on one side of a street may sit in one school district; the house directly across belongs to another. That difference can translate to tens of thousands of dollars in market value.
Research from various urban economics studies has found that homes near higher-performing schools can carry a price premium of 10% or more compared to otherwise similar properties in adjacent districts. The effect is especially pronounced in cities where public school quality varies sharply across neighborhoods.
Two families buy identical-sized homes in the same city, but one is just inside a top-rated school district boundary while the other sits one block outside it.
A neighborhood that was largely bypassed by transit investment for decades sees a light-rail station announced nearby.
A buyer compares two zip codes with similar crime statistics but very different reputations, finding a $90,000 price gap between them.
Jobs, Transit, and the Commute Premium
Proximity to employment centers shapes demand in ways that are easy to underestimate. When a neighborhood offers a 20-minute train commute versus a 75-minute drive, buyers assign real dollar value to that difference. Walkability - measured by scores that estimate how many daily errands can be completed on foot - correlates with higher home prices in most urban markets.
This helps explain why neighborhoods adjacent to thriving job corridors or new transit stations often see price appreciation that outpaces the broader city. Conversely, areas where employers have relocated away, or where highway expansions have disrupted walkability, can stagnate even as the city overall rises.
“People don't just buy houses - they buy access to everything around the house: the schools, the commute, the coffee shop, the park. The building is almost secondary to the location bundle.”
— Urban Economics Researcher, Housing policy and urban land use scholar
Transit investment doesn't instantly close price gaps, but over time it reshapes the geography of demand. Areas that were once bypassed by transit lines can see meaningful appreciation once access improves - a dynamic worth watching if you're evaluating long-term value.
History Baked Into the Price
Some of today's most dramatic price gaps have deep historical roots. Decades of policies - including restrictive lending practices, exclusionary zoning, and uneven infrastructure investment - channeled resources toward certain neighborhoods and away from others. Those patterns created compounding advantages in some areas and compounding disadvantages in others.
Even where discriminatory policies have long since ended, their effects persist in the form of aging housing stock, underfunded local services, and weaker commercial investment in some neighborhoods. These structural gaps don't erase quickly, and they continue to show up in price data today.
Understanding this history is important for buyers and renters who want to interpret price gaps accurately rather than assuming low prices always equal low value - or that high prices always signal quality. Housing data can mislead when stripped of this local context.
If you're evaluating a neighborhood for renting, researching beyond the listing can reveal factors that raw price data won't show.
This article is for general informational purposes only and does not constitute financial, investment, or legal advice. Readers should consult a qualified professional before making real estate decisions.
Frequently Asked Questions
Price differences between ZIP codes reflect a bundle of location-specific factors: school quality, commute access, amenities, and demand. Even a half-mile difference can cross a school district line or change a commute by 20 minutes, both of which shift what buyers are willing to pay.
Yes - significantly. Research consistently finds that homes in higher-rated school districts command a premium, sometimes 10-20% above otherwise comparable properties nearby. Families with children often treat school quality as a non-negotiable, which sustains demand in those areas.
It can, and it does in some cases - particularly when new infrastructure arrives, employers relocate, or revitalization investment flows into an area. However, price convergence is rarely fast, and some gaps reflect deeply entrenched patterns that take decades to shift.
Compare price-per-square-foot across similar neighborhoods, then look for areas where amenities, transit, and schools are improving but prices haven't fully caught up. A <a href="/real-estate/housing-market/reading-a-housing-market-report-without-getting-lost-in-the-numbers">housing market report</a> can help you benchmark values against local trends.
Perceived and reported safety levels influence buyer demand, which affects prices. However, crime statistics can lag reality, and reputation sometimes persists after actual conditions improve or worsen. Buyers should verify current data rather than relying on outdated impressions.
No - the degree of variation differs by city. Highly segregated metros with rigid school district lines or severe housing supply constraints often show the widest gaps. Cities with more integrated services and flexible zoning tend to show smaller intra-city spreads, though some premium always exists.
The content on this site is for informational purposes only and is not a substitute for professional advice. Always consult a qualified professional for guidance specific to your situation.