

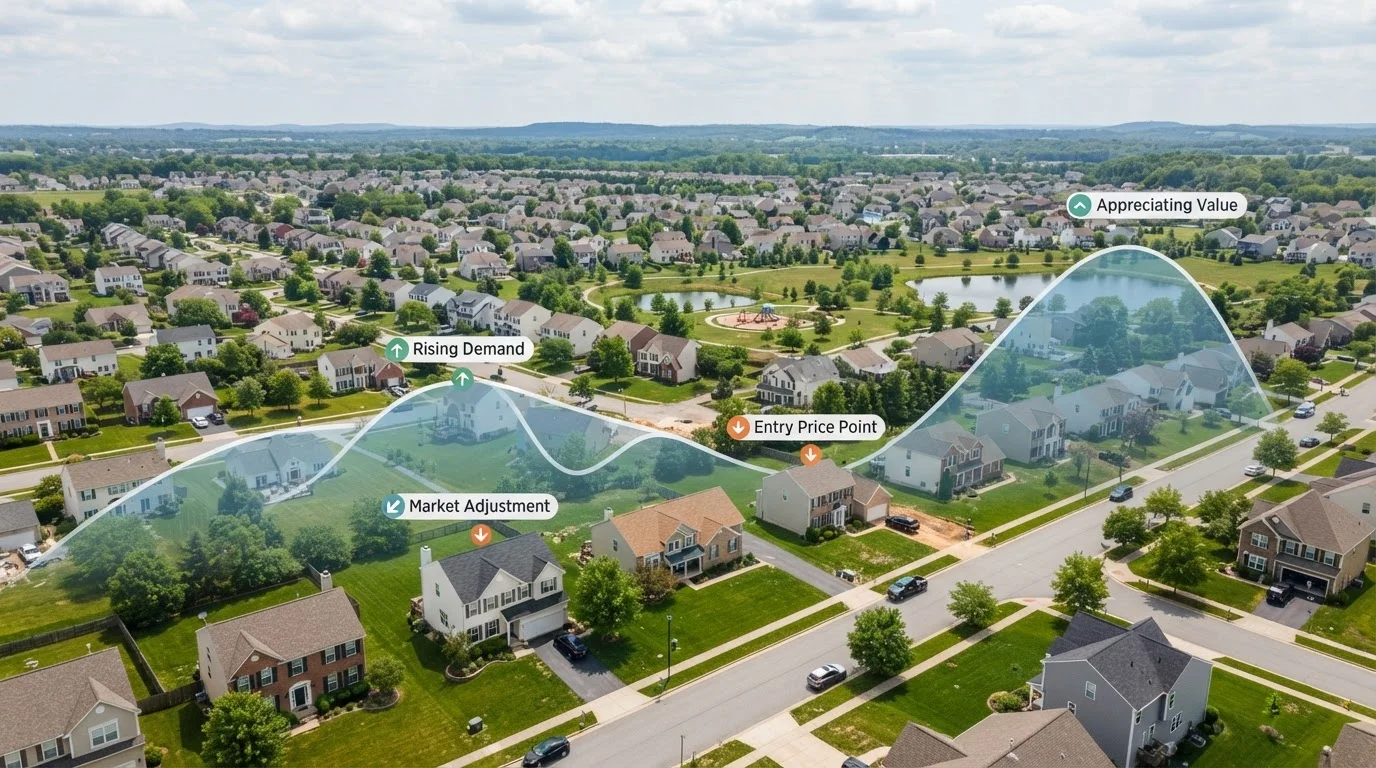
The Four Phases Every Housing Market Moves Through
Real estate doesn't move in a straight line - it cycles. Economists and housing analysts generally describe this movement in four phases, each with distinct characteristics that affect prices, sales volume, and how much negotiating power buyers or sellers hold.
- Expansion: Demand rises, inventory tightens, and prices climb. New construction accelerates. Buyers face competition and bidding wars are common.
- Peak: Price growth slows as affordability strains buyer budgets. Sales activity plateaus even if prices remain near their high point.
- Contraction: Demand falls, inventory builds, and prices soften or decline. Sellers must price more competitively. Days on market stretch longer.
- Recovery: Prices stabilize and begin rising again as economic conditions improve. Buyer confidence returns gradually before the next expansion takes hold.
These phases don't follow a strict calendar, and transitions between them can be gradual and easy to miss in the moment. For an accessible breakdown of the terms that come up during each phase, see the housing market glossary every American should know.
7-18 years
Typical length of a full housing cycle
Housing economists broadly estimate full real estate cycles span 7 to 18 years, though regional variation is significant.
~6 months
Supply level that signals a balanced market
Industry convention holds that roughly six months of available inventory represents equilibrium between buyer and seller leverage.
33%
Peak-to-trough price decline in worst U.S. markets (2006-2012)
According to S&P CoreLogic Case-Shiller data, some metropolitan areas saw home values fall by roughly a third during the post-2006 correction - the steepest decline in modern U.S. housing history.
What Actually Drives Prices Up, Down, and Sideways
Housing prices respond to a handful of powerful forces. Understanding these drivers makes cycle phases far less mysterious.
Interest Rates
When mortgage rates rise, monthly payments on the same loan balance increase - pricing some buyers out of the market entirely. Reduced demand gives sellers less leverage, which eventually restrains price growth. When rates fall, the reverse happens: more buyers can afford more home, pushing prices up. Rate movements are one of the most immediate forces acting on the cycle.
Employment and Income Growth
Strong job markets support housing demand. When workers feel financially secure, they're more likely to commit to homeownership. Regional employment trends help explain why two cities can be at opposite ends of the cycle simultaneously. Economic indicators like jobs reports often signal housing shifts before prices visibly move.
Housing Supply
Building enough homes to meet population growth is notoriously difficult. Zoning restrictions, labor shortages, and material costs slow construction. When supply lags demand persistently, prices rise even as affordability deteriorates. Oversupply - often from a surge in new construction late in an expansion - tips markets toward contraction.
“Real estate markets are driven by long-term demographic and economic forces, not short-term sentiment. Cycles turn slowly, and the signals are usually visible well before prices move.”
— Real Estate Editorial Team, Housing Market Analysis
Why Cycles Feel Different Depending on Where You Live
National housing data is useful context, but it can be misleading if taken as a description of your local market. The U.S. does not have a single, unified housing market - it has thousands of local markets behaving differently at any given time.
A coastal city with tight zoning and high job density may remain in a prolonged expansion while a Rust Belt market with population decline sits in a multi-year contraction. Even within a single metro area, conditions can diverge sharply - as explored in our piece on why the same house costs twice as much across town.
This local variation is also why fears of a national housing crash often overstate the risk. Prices don't fall uniformly or overnight - they ease in some markets while holding firm in others. For a grounded look at how downturns actually unfold, see what people get wrong about a housing market crash.
Separate from long-term cycles, the housing market also follows a predictable annual rhythm - spring tends to be the most active season in most U.S. markets. That seasonal pattern is worth understanding alongside the longer cycle.
How Cycle Awareness Applies to Buyers and Renters
Knowing where the market sits in its cycle doesn't produce a perfect formula for timing a purchase - no analyst can pinpoint peaks or troughs in real time. But cycle awareness does help set realistic expectations and avoid costly misconceptions.
Buyers entering an expansion phase should expect competition and limited negotiating room. Those buying during contraction may find more leverage but should also stress-test their finances against the possibility that prices continue to slide after purchase. Renters are not immune either - landlords in tight rental markets often raise rents during housing expansions as homeownership becomes less affordable for more households. Renting essentials covers how broader market conditions affect lease negotiations and tenant rights.
For those just starting to follow housing data, understanding the housing market as a first-time observer is a practical starting point for interpreting what the numbers actually mean. And if you're actively pursuing a purchase, buying a home walks through the process from search to closing.
This article is for general informational and educational purposes only. It does not constitute financial, investment, or legal advice. Readers should consult qualified professionals regarding their individual circumstances.
Frequently Asked Questions
Most housing cycles span roughly 7 to 18 years from start to finish, though the length varies by region and economic conditions. The post-2008 recovery cycle, for example, stretched unusually long due to historically low interest rates and constrained housing supply. No two cycles are identical.
Prices typically fall when supply outpaces demand - often triggered by rising interest rates, job losses, or an oversupply of new construction. Prices rarely collapse suddenly; they tend to soften gradually as seller competition increases and buyer affordability shrinks.
Historically, national home prices have recovered and eventually surpassed prior peaks after every major downturn in the U.S. However, recovery timelines vary widely by location - some markets bounce back in a few years while others take a decade or longer. Past performance does not guarantee future results.
Higher interest rates increase mortgage costs, reducing what buyers can afford and cooling demand. Lower rates have the opposite effect, stimulating purchases and pushing prices upward. Rate changes are one of the fastest-acting forces in any housing cycle.
No - housing is fundamentally local. National data reflects broad averages, but individual cities and even neighborhoods can be at completely different cycle phases simultaneously. Local job markets, zoning rules, and population trends create distinct conditions in each market.
Watch for key indicators: rising days on market, increasing inventory, and price reductions suggest contraction or early recovery. Bidding wars, shrinking inventory, and fast sales signal expansion or peak. Our <a href="/real-estate/housing-market/economic-indicators-that-move-the-housing-market-before-anyones-talking-about-it">economic indicators guide</a> covers the data points worth tracking.
The content on this site is for informational purposes only and is not a substitute for professional advice. Always consult a qualified professional for guidance specific to your situation.