

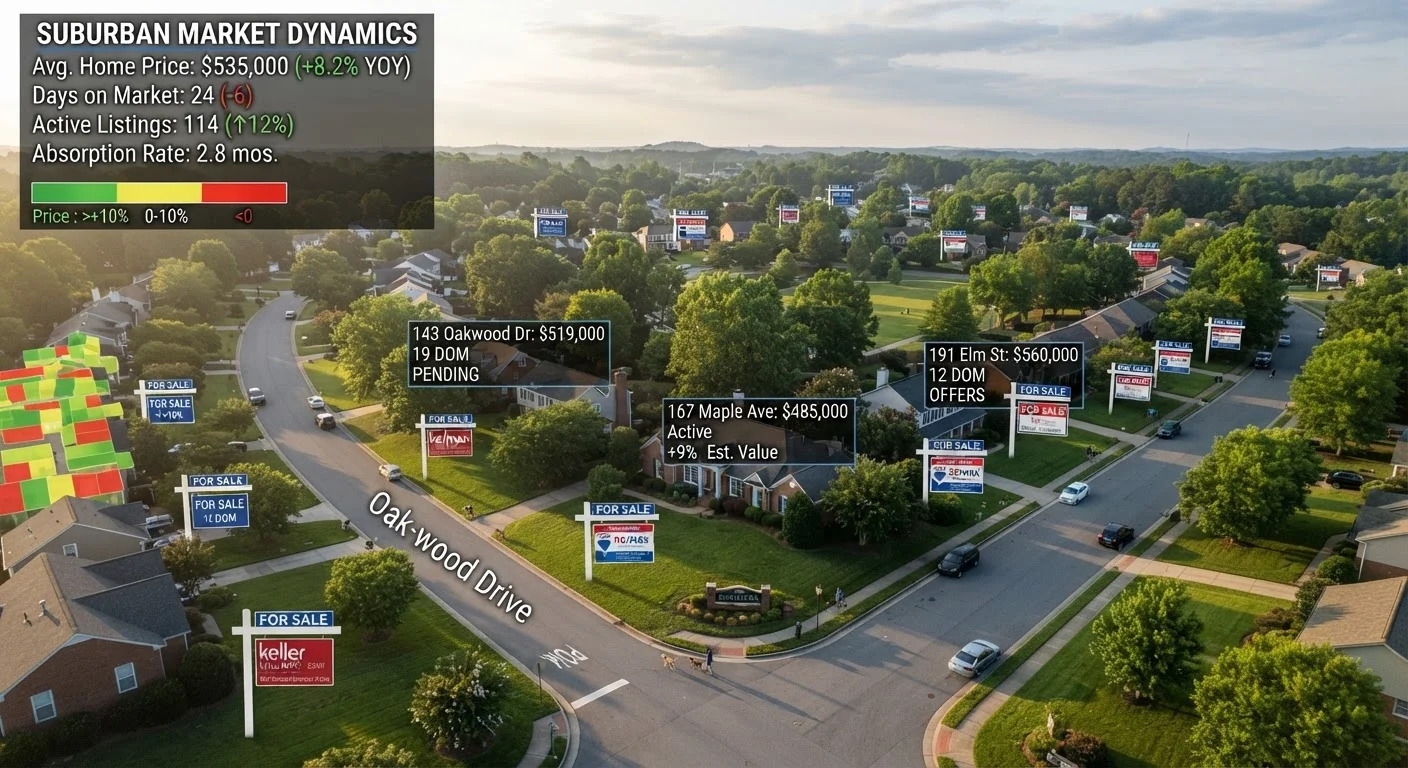
Why Inventory and Demand Are the Market's Two Core Signals
The housing market is constantly moving, but it doesn't move randomly. Two forces drive almost every price shift, bidding war, and buyer's market you'll ever hear about: inventory (the number of homes available for sale) and demand (the number of buyers actively looking to purchase). Together, they determine which side of the negotiating table holds the leverage.
If you've ever wondered why homes in one zip code sell in days while similar properties elsewhere sit for months, the answer almost always comes back to the local balance between supply and demand. Understanding how to read both signals - and how they interact - is a foundational skill for anyone tracking the housing market. For a broader introduction to how prices move over time, see our guide to housing market cycles.
Key Metrics That Reveal Inventory Conditions
Inventory is measured in several ways, and each tells you something slightly different.
- Active listings: The raw count of homes currently for sale in a given area. Rising listings suggest more choice for buyers; falling listings signal tightening supply.
- Months of supply: This is the most widely used inventory benchmark. It's calculated by dividing current listings by the average monthly sales pace. A market with 6 months of supply is considered balanced - fewer than 4 months typically indicates a seller's market, while more than 6 months leans toward buyers.
- New listings per month: Tracking how many new homes come to market each month reveals whether supply is growing or contracting, independent of what's already sitting unsold.
Inventory data is published regularly by the National Association of Realtors, local MLS systems, and real estate data platforms. When reviewing these figures, knowing how to interpret a housing market report helps you avoid drawing the wrong conclusions from a single data point.
4 months
Approximate seller's market threshold for months of supply
The National Association of Realtors has long used roughly 6 months of supply as a balanced-market benchmark, with markets below 4 months generally characterized as favoring sellers.
~20 days
Median days on market in competitive U.S. markets
During periods of elevated buyer competition in major U.S. metros, median DOM has fallen to approximately 20 days or fewer, according to NAR and MLS tracking data from recent market cycles.
Key Metrics That Reveal Demand Conditions
Demand is harder to count directly, but several proxy metrics give you a reliable read on how urgently buyers are competing.
- Days on market (DOM): The average number of days a home sits listed before going under contract. Low DOM - think under 20 days - signals intense buyer competition. A rising DOM suggests buyers are pulling back or becoming more selective.
- List-to-sale price ratio: When homes routinely sell above asking price, demand is outpacing supply. A ratio consistently below 98% suggests buyers have negotiating room.
- Pending home sales: Contracts signed but not yet closed are a leading indicator of demand, showing buyer intent before it shows up in closed-sale data.
- Mortgage application volume: Published weekly by the Mortgage Bankers Association, this data captures how many buyers are actively seeking financing - an early signal of shifting demand.
Demand is also influenced heavily by economic forces beyond the housing market itself. Economic indicators like jobs reports and inflation data often shift buyer behavior before price changes become visible.
Best Practices for Reading These Signals Together
Neither inventory nor demand tells the full story on its own. A spike in listings means very different things depending on whether demand is also rising or falling. Here are the practices that make your market reading more accurate.
Always read months of supply alongside days on market, not in isolation.
Months of supply tells you how much inventory exists relative to sales pace, but it can lag real-time conditions. Days on market shows you what buyers are actually doing right now. Together, they give you both a structural view and a behavioral one.
Track trends over at least three months rather than reacting to a single report.
One month of data can reflect seasonal noise, a holiday slowdown, or a reporting anomaly. Meaningful market shifts reveal themselves through direction and momentum over time, not a single data point.
Compare your local market data to its own historical baseline, not to national averages.
National figures are averages that smooth over enormous regional variation. A market that historically runs at 2 months of supply behaves very differently from one that is normally at 7 months, even if both currently show 4 months.
Use list-to-sale price ratios to gauge negotiating leverage before making an offer.
This ratio directly quantifies how competitive the market is for specific property types or price bands. It translates abstract market conditions into a concrete number that informs offer strategy.
Monitor new listings per month separately from total active inventory.
Active inventory can remain stable even when the market is shifting, if slow sales are offsetting falling new listings. Tracking new supply independently reveals whether the pipeline is growing or shrinking.
Quick Actions You Can Take Right Now
You don't need a real estate license to start tracking these signals. A few focused habits will give you a meaningful read on your local market within a few weeks.
One important caveat: housing markets are intensely local. A national headline about falling inventory may not reflect conditions in your metro area or neighborhood. Always anchor your analysis to the most granular data available. The seasonal rhythm of home sales also affects these metrics - spring typically compresses DOM and raises sale prices even when underlying conditions haven't changed.
This article is intended for general informational and educational purposes only. It does not constitute personalized financial, investment, or real estate advice. Consult a qualified real estate professional or financial adviser before making decisions about buying, selling, or investing in real estate.
The content on this site is for informational purposes only and is not a substitute for professional advice. Always consult a qualified professional for guidance specific to your situation.